How Fixture Pileups Shape Performance Indicators in Cross-Continent Tournament Paths
Written by Ellis Lehmann · Jul 1, 2026
How Fixture Pileups Shape Performance Indicators in Cross-Continent Tournament Paths
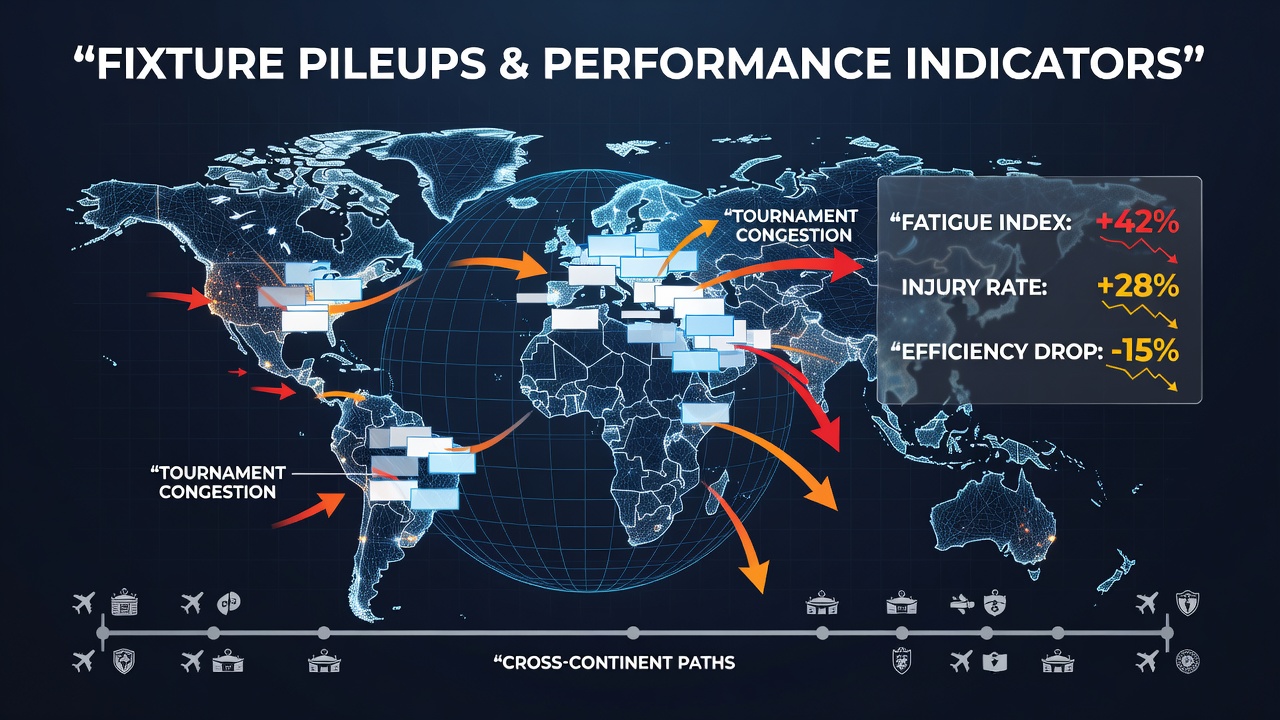
Fixture pileups emerge when national teams face compressed calendars that force multiple high-stakes matches within short windows, especially along paths that span continents for World Cup qualifiers or confederation championships. These overlaps alter recovery windows, training loads, and match availability, which in turn shift standard performance indicators such as distance covered, pass completion rates, and goal conversion percentages. Observers note that continental federations publish fixture calendars years in advance, yet qualification cycles still produce clusters where teams cross time zones repeatedly.
Mechanics Behind Congested Calendars
Qualification groups for events like the 2026 FIFA World Cup require teams from AFC, CAF, CONMEBOL, and UEFA to complete home-and-away ties plus playoff stages, often scheduled around domestic leagues that already occupy midweek slots. When two or three matches land inside ten days and each involves intercontinental flights, the cumulative load shows up first in GPS-tracked metrics that national federations share with confederations. Data collected during the 2022 cycle indicated that squads logging more than 25,000 kilometres in a single month recorded average reductions of 8 percent in high-intensity running compared with less-travelled opponents.
Travel Distance and Recovery Windows
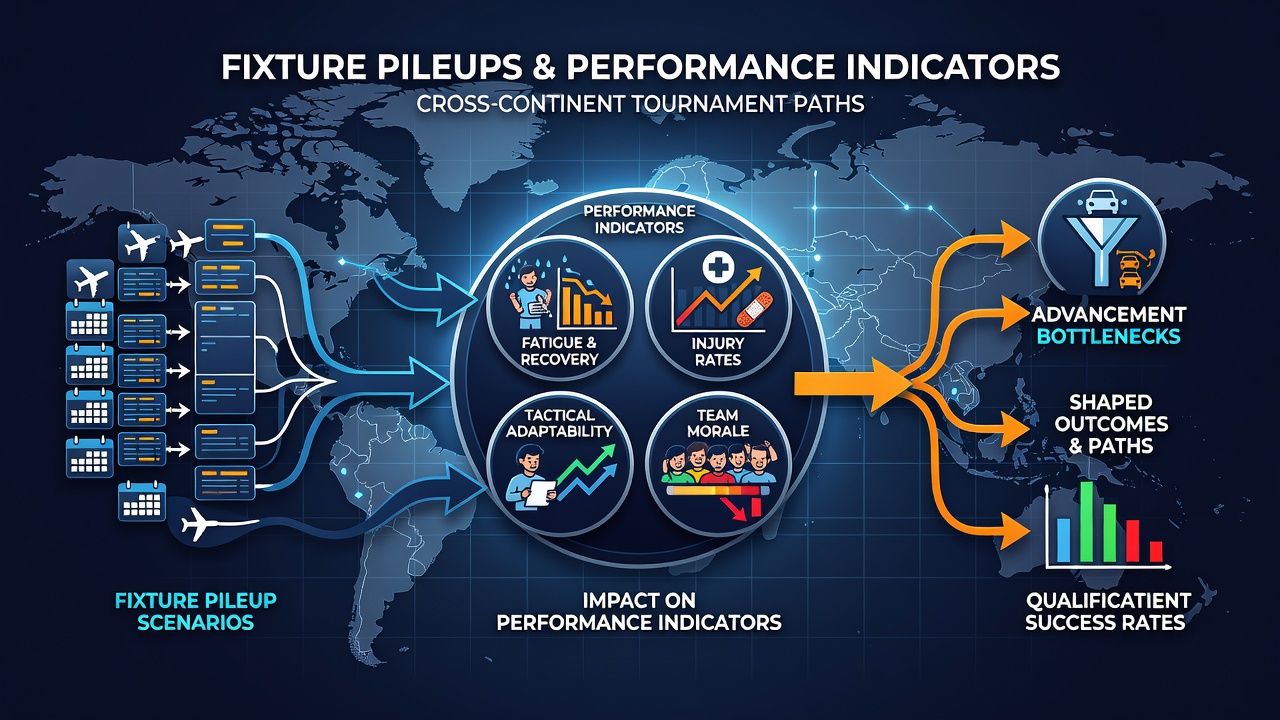
Cross-continent routes introduce additional variables because circadian disruption compounds muscular fatigue. Teams moving from South America to Europe or from Africa to Asia face 10-to-14-hour flights followed by immediate training sessions on arrival. Performance analysts track heart-rate variability and sleep scores through wearable devices; those readings frequently drop below baseline thresholds within 48 hours of landing. Studies coordinated by the Australian Institute of Sport have documented slower reaction times and reduced sprint repeatability in players whose travel exceeded eight time zones within a 14-day qualification window.
Measurable Changes in Key Indicators
Goal-scoring efficiency tends to decline when fixture density rises, because chance creation drops once teams reduce pressing intensity to conserve energy. Pass accuracy in the final third also slips by two to four percentage points in the second match of a double-header, according to aggregated Opta datasets released after CONMEBOL qualifiers. Defensive metrics reveal similar patterns: teams concede higher expected goals after back-to-back fixtures because recovery runs decrease and positional discipline loosens in the final 20 minutes. Injury incidence rises in parallel; UEFA medical reports from overlapping European and World Cup windows list soft-tissue complaints increasing by roughly 15 percent when rest intervals fall below 72 hours between matches.
Regional Patterns Across Confederations
CONMEBOL sides often absorb the heaviest travel loads because their qualification groups require long-haul trips to both Asia and Europe for playoff ties. CAF nations encounter comparable distances when facing Asian opponents in neutral-venue playoffs. In contrast, UEFA teams sometimes benefit from shorter intra-European legs, yet still face pileups when Nations League fixtures overlap with World Cup preliminaries. July 2026 sits eight months after the final qualification window closes, giving confederations time to review how these patterns influenced final squad selections and to adjust future calendars accordingly.
Examples From Recent Qualification Cycles
One documented sequence occurred when a South American side played three matches in 11 days, travelling from high-altitude venues to sea-level stadiums across two continents. Match logs showed a progressive drop in completed crosses and successful take-ons, while the number of turnovers in midfield rose steadily. Another case involved an African team that flew from West Africa to the Middle East and back within nine days; their post-match recovery reports noted elevated creatine kinase levels that correlated with reduced pressing success in the third fixture. These sequences illustrate how cumulative load translates into concrete statistical shifts rather than isolated anomalies.
Adjustments by Coaching Staffs
Technical staffs respond by rotating personnel earlier and altering tactical setups to reduce high-intensity requirements. Squad lists submitted to confederations now routinely include additional goalkeepers and defenders to offset potential absences. Load-management protocols, shared between clubs and national teams under FIFA guidelines, allow some players to skip training days between matches, which has produced modest stabilisation in pass-completion figures during the later stages of congested blocks. The effect remains partial because fixture lists themselves are fixed by the qualification draw and cannot be altered once published.
Conclusion
Fixture pileups therefore function as structural constraints that reshape performance indicators across entire qualification campaigns. Travel volume, recovery time, and match density interact to produce measurable declines in running metrics, technical accuracy, and injury resilience. Confederations continue to collect and publish these data sets, enabling future calendar refinements that may reduce overlap while preserving the integrity of cross-continent qualification paths.